


Statistics can help illuminate the game of football…or they can take us down a misleading path. As Tampa Bay Buccaneers Head Coach Lovie Smith said: "I believe in stats, but it's [which] stats."
Smith, for instance, doesn't pay much attention to the NFL's defensive rankings, since they are based on yards, which he considers a meaningless measure. When he shares defensive stats with his team, he focuses on points allowed, takeaways, scoring on defense and red zone proficiency.
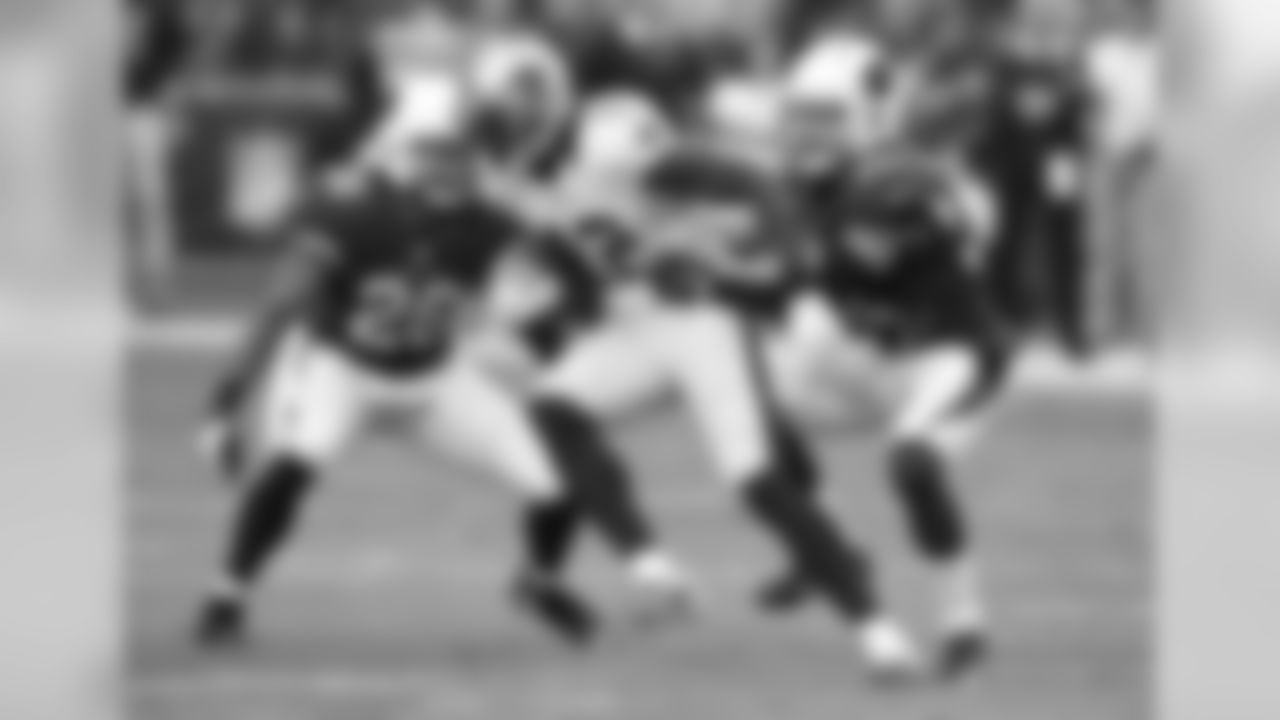
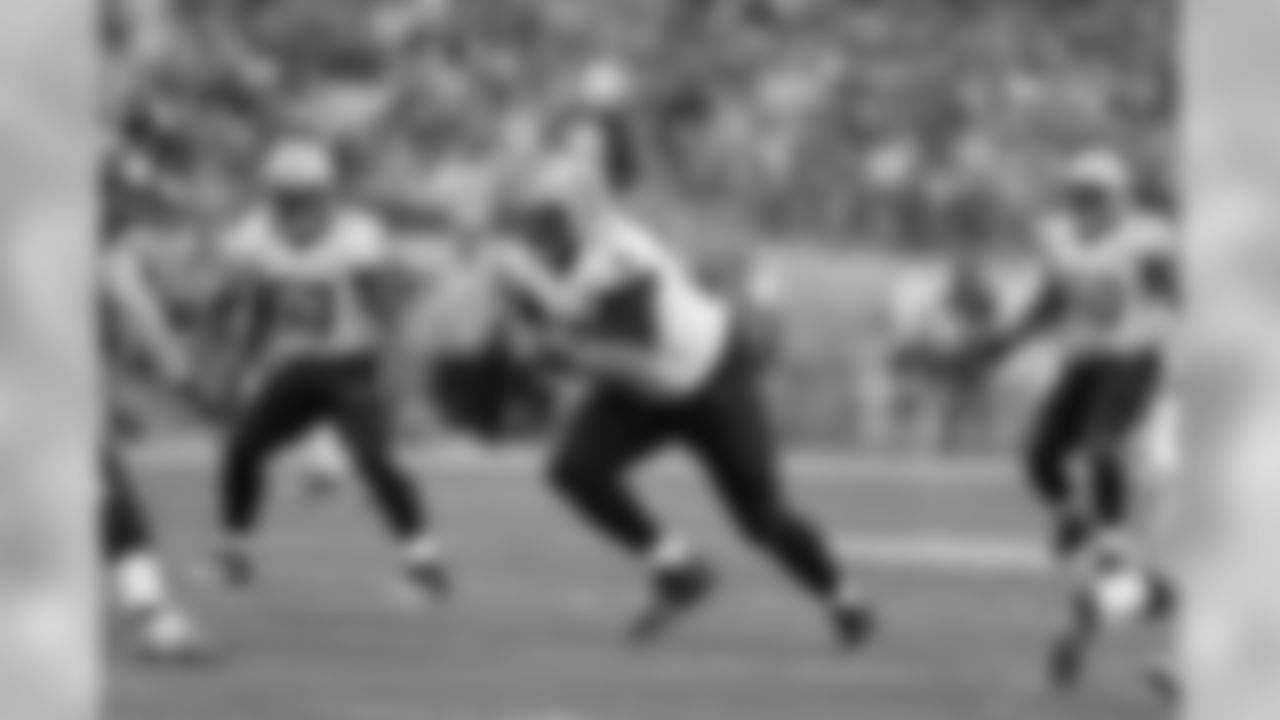
Photos of the Saints' starters via team depth chart.


Here on Buccaneers.com, we unabashedly love stats, but we also understand the need to wield them wisely. Sometimes, we can get a better feel for why the team is performing as it is by going a little deeper into the numbers. Other times, we simply want to point out a few numbers we consider interesting, and hope you will find it interesting as well.
That's our goal with Football Geekery. Each week, we're going to give you a sampling of statistical and/or historical analysis, hopefully in a way that is relevant to the Buccaneers' current state of affairs. This week, we look at a group of very successful teams that Tampa Bay could join this year if it keeps running the ball and defending the run well. We also note a potential opportunity for Doug Martin this week and find other WR tandems as good at moving the chains as Mike Evans and Vincent Jackson. Let's get started.
1. Dominating on the Ground
On Monday, after the Bucs ran for 166 yards and allowed 64 in a Week 13 win over Atlanta – the third straight game in which Tampa Bay out-rushed its opponent by more than 100 yards – we noted that the team is on pace for its best rushing yardage differential in franchise history. With four games to play, the Bucs have out-rushed their opponents by 584 yards.
On a per-game basis, the Buccaneers are averaging 143.3 rushing yards while allowing 94.7. They are one of three teams in the NFL this season that can boast an offensive average of 140 or better and a defensive average less than 100. The other two are the 12-0 Carolina Panthers and the 7-5 Seattle Seahawks.
READ: KEY MATCHUPS
It's not surprising to see teams with that much of an edge in the running game have winning records. On Wednesday, New Orleans Saints Head Coach Sean Payton, who will bring his team to Raymond James Stadium on Sunday, made note of the Buccaneers' good results this year in the ground game, both offensively and defensively. Said Payton: "So when you're stopping the run as effectively as they are and running the ball as effectively as they are, that's a good starting point."
As if often the case, Payton knew what he was talking about. Since the 1970 AFL-NFL merger, there have been 55 teams to meet that criteria of at least 140 rushing yards per game on offense and fewer than 100 on defense, not including the Bucs, Panthers and Seahawks this year. Incredibly, only two of those 55 teams finished the season with losing records. The two exceptions were the 1990 San Diego Chargers (6-10) and last year's New York Jets (4-12). All but 10 of those 55 teams made the playoffs. Since Carolina has already clinched both a winning record and a division title, you can basically update those totals to 54 of 56 non-losing teams and 46 of 56 playoff teams. The Buccaneers and Seahawks may very well make it 56 of 58 and 48 of 58.
The 1983 season is a great example of what that sort of two-way run dominance can mean for a team. That year, there were two clubs that met the above criteria of 140+-rushing yards per game and fewer than 100 rushing yards allowed per game: the Los Angeles Raiders and the Washington Redskins. At the end of that campaign, the Raiders beat the Redskins in Super Bowl XVIII, 38-9…coincidentally in the first Super Bowl played in Tampa. More recently, the 2012 San Francisco 49ers and last year's Seahawks used that formula to get to the championship game before falling. Overall, 11 Super Bowl teams have fit the above criteria, including six champions.
Here's the entire list of those teams:
Team
Season
YPG
Opp. YPG
W
L
T
Pct.
Detroit Lions
1970
151.9
82.3
10
4
0
.714
Baltimore Colts
1971
153.5
79.5
10
4
0
.714
Dallas Cowboys
1971
160.6
81.7
11
3
0
.786
Los Angeles Rams
1973
208.9
90.7
12
2
0
.857
Dallas Cowboys
1974
175.3
96.0
8
6
0
.571
Los Angeles Rams
1974
151.8
93.0
10
4
0
.714
Detroit Lions
1980
162.4
99.9
9
7
0
.563
Los Angeles Raiders
1983
140.0
99.1
12
4
0
.750
Washington Redskins
1983
164.1
80.6
14
2
0
.875
Chicago Bears
1984
185.9
86.1
10
6
0
.625
Washington Redskins
1984
142.1
99.3
11
5
0
.688
Chicago Bears
1985
172.6
82.4
15
1
0
.938
New York Giants
1985
153.2
92.6
10
6
0
.625
New York Jets
1985
144.5
94.8
11
5
0
.688
Chicago Bears
1986
168.8
91.4
14
2
0
.875
New York Giants
1986
140.3
80.3
14
2
0
.875
Chicago Bears
1988
144.9
82.9
12
4
0
.750
Houston Oilers
1988
140.6
99.5
10
6
0
.625
San Francisco 49ers
1988
157.7
99.3
10
6
0
.625
Chicago Bears
1990
152.3
98.3
11
5
0
.688
Philadelphia Eagles
1990
159.8
73.1
10
6
0
.625
San Diego Chargers
1990
141.1
94.7
6
10
0
.375
Buffalo Bills
1992
152.3
87.2
11
5
0
.688
Philadelphia Eagles
1992
149.3
92.6
11
5
0
.688
San Francisco 49ers
1992
144.7
88.6
14
2
0
.875
Denver Broncos
1996
147.6
83.2
13
3
0
.813
Pittsburgh Steelers
1996
143.7
88.4
10
6
0
.625
Pittsburgh Steelers
1997
154.9
82.4
11
5
0
.688
Tennessee Oilers
1997
150.9
98.3
8
8
0
.500
Denver Broncos
1998
154.3
80.4
14
2
0
.875
Denver Broncos
2000
144.4
99.9
11
5
0
.688
Oakland Raiders
2000
154.4
96.9
12
4
0
.750
Pittsburgh Steelers
2001
173.4
74.7
13
3
0
.813
San Francisco 49ers
2001
140.3
98.2
12
4
0
.750
Denver Broncos
2002
141.6
93.1
9
7
0
.563
Miami Dolphins
2002
156.4
97.1
9
7
0
.563
Baltimore Ravens
2003
167.1
96.0
10
6
0
.625
Denver Broncos
2004
145.8
94.5
10
6
0
.625
New York Jets
2004
149.3
97.9
10
6
0
.625
Pittsburgh Steelers
2004
154.0
81.2
15
1
0
.938
Denver Broncos
2005
158.7
85.2
13
3
0
.813
Kansas City Chiefs
2005
148.9
98.1
10
6
0
.625
Seattle Seahawks
2005
153.6
94.4
13
3
0
.813
Jacksonville Jaguars
2006
158.8
91.3
8
8
0
.500
Minnesota Vikings
2007
164.6
74.1
8
8
0
.500
Baltimore Ravens
2008
148.5
81.4
11
5
0
.688
Minnesota Vikings
2008
146.1
76.9
10
6
0
.625
New York Giants
2008
157.4
95.8
12
4
0
.750
New York Jets
2009
172.3
98.6
9
7
0
.563
New York Jets
2010
148.4
90.9
11
5
0
.688
Houston Texans
2011
153.0
96.0
10
6
0
.625
San Francisco 49ers
2012
155.7
94.2
11
4
1
.719
Washington Redskins
2012
169.3
95.8
10
6
0
.625
New York Jets
2014
142.5
93.1
4
12
0
.250
Seattle Seahawks
2014
172.6
81.5
12
4
0
.750
Carolina Panthers
2015
141.9
87.2
12
0
0
1.000
Seattle Seahawks
2015
146.6
87.8
7
5
0
.583
Tampa Bay Buccaneers
2015
143.3
94.7
6
6
0
.500
Totals
620
283
1
.686
The bottom row shows the win-loss totals for all of those teams combined. They produce an overall winning percentage of .686. Apply that to a 16-game season and you get almost exactly 11 wins. The Buccaneers won't get to 11 wins this year, but they might just make the playoffs for the first time in eight years, and if they do so they'll have their dominance in the ground game to thank for it.
2. Warning: Explosives.
We ran through that entire note on rushing dominance without mentioning the name of the player most responsible for the Buccaneers' big numbers on offense: running back Doug Martin. Heading into Week 14, Martin ranked second in the NFL with 1,133 rushing yards, putting him on pace for 1,511 by season's end. After Minnesota's Adrian Peterson rushed for 69 yards in Arizona on Thursday night to push his league-leading total to 1,251, Martin goes into his Sunday game against the Saints needing 119 to take over the top spot.
The good news for Martin: He'll be facing in the NFL's 32nd-ranked rushing defense. The Saints are allowing 137.8 rushing yards per game and 4.9 yards per carry, both the worst figures in the league. More specifically, the Saints have vulnerable to what Buccaneers Offensive Coordinator Dirk Koetter calls "explosives." Koetter defines those as runs of 15 or more yards and completions of 25 or more yards. As we discussed in last week's Football Geekery, explosive plays (on both sides of the ball) are half of the formula that make up a very telling statistic called "Toxic Differential." The other half of that formula is turnover differential; put those two together and the Bucs rank in the top 10 in Toxic Differential this year.
The Buccaneers may need to create a handful of turnovers on defense to come away with a critical win on Sunday, but they would also be greatly aided by big plays out of Doug Martin and the rushing attack. Fortunately for him, this is a good week to build on his high number of explosives.
As noted above, Koetter and the Bucs use 15 yards as the cutoff for their explosive runs, but others choose to calculate it with 10 or 20-yard runs. Martin has been among the league leaders in both categories this year.
Most Rushes of 10+ Yards, NFL, 2015
Player
Team
No.
- Adrian Peterson*
Minnesota
39
- Doug Martin
Tampa Bay
27
- LeSean McCoy
Buffalo
26
- Devonta Freeman
Atlanta
25
- Chris Ivory
N.Y. Jets
24
Most Rushes of 20+ Yards, NFL, 2015
Player
Team
No.
- Doug Martin
Tampa Bay
11
- Adrian Peterson*
Minnesota
9
3t. Le'Veon Bell
Pittsburgh
8
3t. Todd Gurley
St. Louis
8
4t. Chris Ivory
N.Y. Jets
7
4t. Latavius Murray
Oakland
7
4t. Thomas Rawls
Seattle
7
** Peterson has already played a 13th game; the rest have played 12.
Martin is about to face the team that has given up the most runs of 10 or more yards this year, and in the next two weeks he'll face two of the top five teams in terms of allowing runs of 20 or more yards.
*Most Rushes of 10+ Yards Allowed, Team, 2015
- New Orleans
53
- Miami
49
- Cleveland
45
4t. Green Bay
42
4t. Washington
42
Most Rushes of 20+ Yards Allowed, Team, 2015
- San Diego
15
2t. Cleveland
12
2t. New Orleans
12
2t. St. Louis
12
- Indianapolis
11
Martin is also chasing the Buccaneers' single-season rushing record of 1,544, set by James Wilder more than three decades ago, in 1985. He needs 412 more yards to surpass that mark, or 103 per game. The numbers above suggest that Martin could bite into that total with some big chunks in Sunday's game against the Saints.
3. Evans, Jackson Moving the Chains
As we also noted on Monday in our weekly Stat Shots roundup from the previous game, Vincent Jackson and Mike Evans are currently running first and second in the NFL in first-down percentage. That refers to the percentage of a player's receptions that result in first downs, and the player must have an average of at least two receptions per his team's game to qualify for the league lead.
If that Buccaneer duo can hold on to the top two spots for one more month, they would pull off a relatively uncommon feat. First down data has been tracked since 1991, and in that span, according to Statspass, only three other pairs of teammates have finished a season ranked first and second in first-down percentage. Here are the four groups, including the current Buccaneer tandem:
Team
Season
Player #1
Pct.
FD-REC
Player #2
Pct.
FD-REC
WAS
1997
Henry Ellard
90.6
29-32
Michael Westbrook
88.2
30-34
TEN
2003
Justin McCareins
85.1
40-47
Drew Bennett
84.4
27-32
SD
2011
Malcom Floyd
95.3
41-43
Vincent Jackson
90.0
54-60
TB
2015
Vincent Jackson
87.5
28-32
Mike Evans
83.3
45-54
One notable takeaway from the chart above is that this isn't the first time that Jackson has been in this position. He has a career mark of 81.1%, which is second among all qualifiers to Henry Ellard since 1991.
Another takeaway is that Evans and Jackson currently have a combined 86 catches. Of the groups above, Jackson and Floyd had the most combined catches, 103 for San Diego in 2011. So far this year, Evans has averaged just a hair under five catches per game when he's been on the field, while Jackson has averaged roughly 3.5 receptions for game he's played. At that rate, Evans and Jackson would finish the season with a combined 120 receptions. Obviously, if you're getting first downs nearly every time you catch the ball, the more catches you get the more valuable you are.


