


Get to know the key players on Green Bay before the Buccaneers take on the Packers Sunday at Raymond James Stadium.


Statistics can help illuminate the game of football…or they can take us down a misleading path. As Tampa Bay Buccaneers Head Coach Lovie Smith said: "I believe in stats, but it's [which] stats."
Smith, for instance, doesn't pay much attention to the NFL's defensive rankings, since they are based on yards, which he considers a meaningless measure. When he shares defensive stats with his team, he focuses on points allowed, takeaways, scoring on defense and red zone proficiency.
Here on Buccaneers.com, we unabashedly love stats, but we also understand the need to wield them wisely. Sometimes, we can get a better feel for why the team is performing as it is by going a little deeper into the numbers. And sometimes we can simply point out something we consider interesting, and hope you will find it interesting as well.
That's our goal with Football Geekery. Each week, we're going to give you a sampling of statistical and or historical analysis, hopefully in a way that is relevant to the Buccaneers' current state of affairs. This week we examine two topics, beginning with the notion that Tampa Bay has failed to stick with the running game in the second half after some recent good work in the first half. As usual, that examination requires a serious look at cause and effect, as well. We also consult a very useful chart on the Football Outsiders site to see whether Green Bay's pass defense might be more vulnerable against the established Jackson-Evans duo or against some of the newer options to arise for the Buccaneers. Let's get started.
**
1. Running After the Half
Running back Doug Martin's third NFL season started out slowly thanks to injuries and a string of early games in which the Buccaneers' offense was too often in catch-up mode. Lately, the 2012 rookie Pro Bowler has drawn praise for his efforts, as he has rounded into better health and shown off the burst and hard cuts that led to 1,926 yards from scrimmage in 2012.
Martin has run for 176 yards and one touchdown over the last three games. Those aren't overwhelming numbers, of course, but he's picking up 4.8 yards per carry, which is a little better than what he averaged as a rookie. There is reason to believe he could have more eye-catching numbers if he had more opportunities, and virtually everyone has noticed a certain trend during that three week span. Of those 176 yards against Cincinnati, Detroit and Carolina, 159 have come before halftime and only 17 after.
Again, this has been no secret, and it's certainly not something that would escape the notice of the Bucs' coaching staff. But the scoreboard, the down-and-distance and the desire to get rookie RB Charles Sims involved in certain packages can all affect the eventual play-calling, even if the game plan originally called for a bigger dose of Martin. For instance, the Buccaneers committed a false start to open the first drive of the second half on Sunday in Carolina and ended up throwing to try to get out of that hole. On the next drive, they gave it to Martin twice but the first run was stuffed deep in the backfield. On the third drive of the half, a false start once again got things going in the wrong direction on third down. The Buccaneers didn't start a single drive with a field position more advanced than their own 20-yard line in the entire second half, and since they were trailing most of the way they had to look for ways to pick up bigger chunks of yardage at a time.
Still, there is a general perception that the Buccaneers have not "stuck with the run" this season, so let's take a look at the numbers to see if there's anything to that.
In the chart below you will see all 32 NFL teams and their percentage of run and pass plays called in each half. The "Run % Rank" column after each set of half numbers indicates how high their percentage of run plays called ranks against the rest of the teams. The "2nd Half Rise" column indicates how much their percentage of run plays called increased or decreased from the first half to the second half. A positive number means the team ran more frequently in the second half. The final "Rank Rise" column indicates the difference in each team's rank of run-play percentage from the first half to the second half. A positive number means the team ran more often relative to the rest of the league in the second half.
1st Run%
1st pass%
Run % Rank
2nd run%
2nd pass%
Run % Rank
2nd Half Rise
Rank Rise
SEA
46.1
53.9
7
55.9
44.1
1
9.8
6
HOU
50.1
49.9
2
54.5
45.5
2
4.4
0
DAL
46.1
53.9
8
53.5
46.5
3
7.4
5
PHI
36.5
63.5
28
48.3
51.7
4
11.8
24
BAL
42.7
57.3
11
47.9
52.1
5
5.2
6
CIN
48.4
51.6
4
47.8
52.2
6
-0.6
-2
GB
37.8
62.2
24
47.6
52.4
7
9.8
17
CLE
47.8
52.2
5
46.6
53.4
8
-1.2
-3
SF
44.0
56.0
9
45.9
54.1
9
1.9
0
DEN
39.3
60.7
19
44.9
55.1
10
5.6
9
AZ
39.0
61.0
20
44.0
56.0
11
5.0
9
KC
47.4
52.6
6
43.3
56.7
12
-4.1
-6
NE
38.9
61.1
21
43.2
56.8
13
4.3
8
IND
34.3
65.7
31
42.4
57.6
14
8.1
17
NYG
40.7
59.3
16
42.2
57.8
15
1.5
1
SD
38.9
61.1
22
42.0
58.0
16
3.1
6
NYJ
53.2
46.8
1
41.7
58.3
17
-11.5
-16
CAR
42.9
57.1
10
41.7
58.3
18
-1.2
-8
PIT
37.7
62.3
25
41.5
58.5
19
3.8
6
DET
34.9
65.1
29
41.1
58.9
20
6.2
9
NO
34.6
65.4
30
40.9
59.1
21
6.3
9
MIN
41.3
58.7
15
40.3
59.7
22
-1.0
-7
MIA
38.0
62.0
23
39.9
60.1
23
1.9
0
BUF
39.5
60.5
18
39.7
60.3
24
0.2
-6
WAS
41.5
58.5
14
37.2
62.8
25
-4.3
-11
ATL
37.2
62.8
26
36.7
63.3
26
-0.5
0
CHI
34.0
66.0
32
36.6
63.4
27
2.6
5
STL
48.6
51.4
3
36.5
63.5
28
-12.1
-25
TEN
41.7
58.3
12
35.7
64.3
29
-6.0
-17
TB
39.9
60.1
17
33.3
66.7
30
-6.6
-13
JAX
41.6
58.4
13
32.7
67.3
31
-8.9
-18
OAK
37.0
63.0
27
28.6
71.4
32
-8.4
-5
Much of this chart should simply reinforce something we've discussed before when talking about running the ball, wins and the causality between the two. Teams with losing records often have lower run-play percentages because they are more often trying to overcome deficits and less often trying to run out the clock and play ball-control football in the second half. It should come as no surprise that the last four teams on this list – again, it is currently ranked by run-play percentage in the second half, all came into Week 16 with 2-12 records.
Tampa Bay has been about the middle of the pack when it comes to its percentage of running plays in the first half this season, and that includes a couple of games that got away very early. They have been picking up 3.99 yards per carry in the first half, which ranks 23rd in the league and is obviously an area that calls out for improvement in 2015. Interestingly, the team's second-half yards per carry drops only to 3.85, which ranks 19th in the NFL. In other words, the Buccaneers really haven't done any worse, relative to the rest of the league, running the ball in the second half. But the team's run-play percentage drops by 6.6 points from 39.9 to 33.3. That's not a big of a drop as one sees from Jacksonville, Oakland, the N.Y. Jets or even the almost-.500 St. Louis Rams.
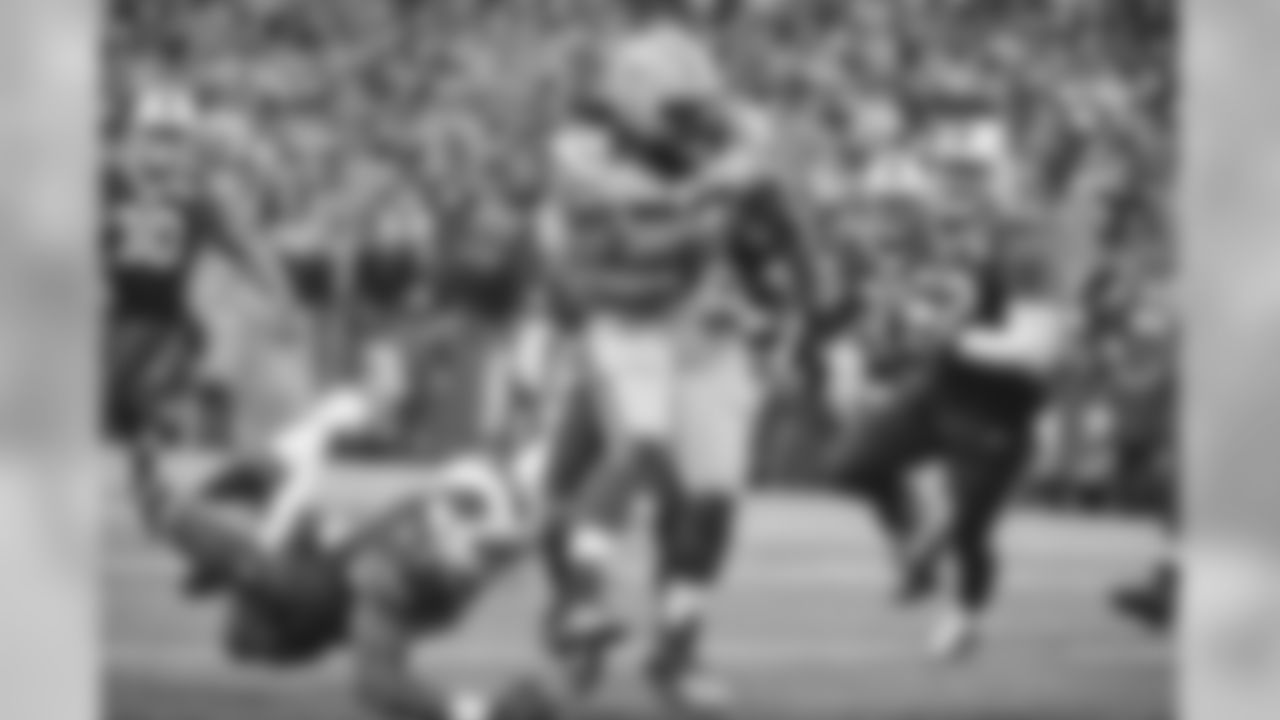
Almost every team that has in the thick of the playoff race has a positive number in that second-to-last column. For instance Green Bay, the Buccaneers' upcoming opponent, runs the ball on 37.8% of plays before halftime and then 47.6% after halftime. Again, this presumably has a lot to do with the scoreboard as the Packers can afford to be more conservative, bleed the clock and pound away with their 250-pound back, Eddie Lacy.
2. Where to Throw?
The Buccaneers head into Sunday's game with a reasonable shot at getting not one but two receivers over the 1,000-yard mark before the final whistle. Rookie WR Mike Evans needs 52 yards to get there while veteran Vincent Jackson could make it for the sixth time in the last seven years with 69 more.
Meanwhile, Tampa Bay's passing attack lost its usual third receiver last Sunday, as WR Louis Murphy incurred an ankle injury that pushed him to injured reserve. Rookie TE Austin Seferian-Jenkins also went to I.R. this week, and he is the Buccaneers' fifth-leading pass-catcher this season. At the same time, rookie running back Charles Sims is starting to become more involved in the passing attack, and a green player like Russell Shepard could grab some opportunities in the slot.
Who among these candidates is most likely to find the success they are seeking against the Packers' defense. Let's consult one of our favorite sources from last season, the "2014 DEFENSE vs. TYPES OF RECEIVERS" chart on FootballOutsiders.com. (On the linked page, scroll down to the middle of the three charts.)
This source gives an idea of how each team defense has fared against five different types of pass-catches: #1 WRs, #2 WRs, Other WRs (e.g. slot receivers), TEs and RBs. In each case it uses the signature Football Outsider DVOA stat, a comprehensive rating that is summed up here. All you need to know for this discussion is that negative numbers are better for the defense.
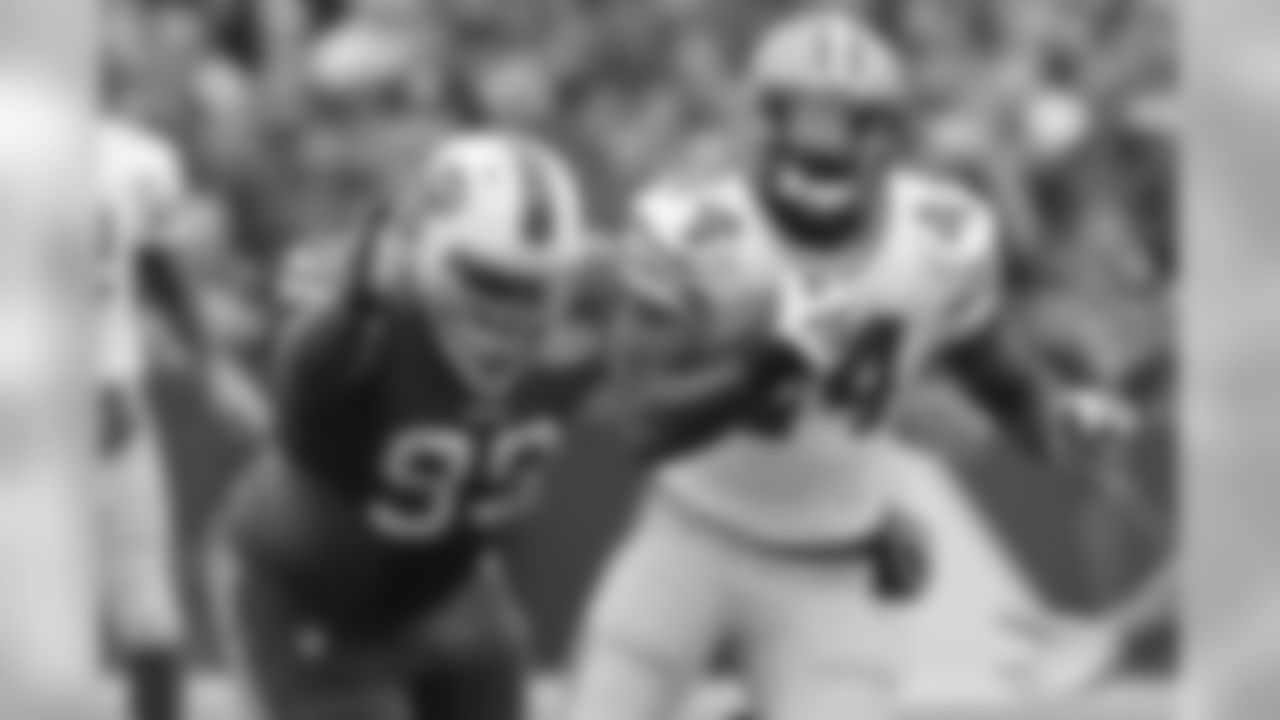
Overall, the Packers have done better against the pass (ranked 15th in yards allowed and 15th in DVOA) than against the run (26th and 21st). They've also been relatively solid across the board, as you can see in the team's ranking among the 32 teams in DVOA against those five types of pass-catchers.
Receiver Type
DVOA
NFL Rank
vs. #1 WRs
-0.5%
15th
vs. #2 WRs
-15.7%
7th
vs. Other WRs
-8.5%
8th
vs. TEs
-4.4%
16th
vs. RBs
8.7%
22nd
So congrats Charles Sims (and Martin and Bobby Rainey)! If the Packers' defense is vulnerable to any kind of passing, it's short throws to running backs, and Tampa Bay's screen-pass game has shown serious signs of life in recent weeks.
Whether this is a more difficult challenge for Evans or Jackson depends upon which one you consider the #1 WR. Evans leads in yards and touchdowns, Jackson in catches. The emphasis from opposing defenses seemed to switch from Jackson to Evans last month when the rookie had a monster November, but it could switch back with Jackson putting up big numbers in recent weeks. Whether it's Shepard or Robert Herron or recently-promoted Tavarres King who gets the first crack at Murphy's slot job, it won't be an easy debut, as the Packers and nickel back Casey Hayward have defended that well.
SUGGESTED
NEWS: Top 10 Quotes of the WeekNEWS:
Key Matchups: Buccaneers vs. PackersPHOTOS:*
Meet the PackersVIDEO:* Keys to the Game: Packers*VIDEO: *
Coach Smith's Presser


